


Macro Update
by Dean Orrico, President & CEO and Robert Lauzon, Managing Director & CIO
President Trump’s Liberation Day tariff announcements sparked a sharp market sell-off. The S&P 500 fell over 10% in the two-days following the event, erasing more than $5 trillion in market capitalization. This comes after the S&P 500 returned -5.6% in Q1 – its worst quarterly performance in 3 years. Needless to say, it has been a challenging environment for equity investors in recent weeks. As of April 4th, the SPX corrected 17.5% from its all-time highs made on February 19th, – the sixth-fastest decline into correction territory since 1920.
Trump’s April 2nd tariff announcements were worse-than-feared and have created more uncertainty than expected clarity. Rather than aligning tariff rates with conventional trade frameworks, the administration opted to target countries based on the size of their trade deficits with the U.S. — a clear deviation from initial expectations. This approach led to disproportionately high tariff rates for certain countries and were far more widespread than anticipated. Markets are now recalibrating for the inflationary and economic consequences of these policies, reigniting fears of stagflation. In the coming days, we will be watching to see which countries are willing to play ball with the administration and make concessions for lower tariffs, and which countries will respond with retaliatory measures, like those we have already seen from China.
Canada and Mexico were notable exclusions on Liberation Day with their previously announced tariff rules left unchanged.
This means that trade that falls under the USMCA (we expect roughly 80% of Canadian exports to the U.S. will ultimately be USMCA compliant) will be tariff free, while previously announced tariffs on steel, aluminum and autos will remain in effect. Despite being the first to be targeted by Trump’s tariff agenda, the Canadian stock market has outperformed the U.S. this year. In Q1, the TSX Composite generated a total return of 1.5%, outperforming the S&P 500 by nearly 6%. We believe the recent streak of outperformance is poised to continue. With a federal election on the horizon, we expect a shift toward greater policy clarity, and regardless of the outcome, the prevailing political momentum appears to favor more business-friendly, pro-growth initiatives. Beyond the political backdrop, Canada offers structural advantages that support long-term investment, including a highly educated workforce producing world-class talent in engineering and technology, abundant natural resources, and access to some of the cheapest and cleanest energy globally. The TSX Composite is trading at a 4.5x multiple discount to the S&P 500 with comparable earnings growth and several catalysts on the horizon.
While our cautious perspective calls for a more defensive positioning, there are some encouraging developments and potential offsets worth noting. First, there have been signs of resistance to Trump’s tariff policies within the Senate toward reasserting its authority over trade and tax policy, which could eventually curb the executive branch’s ability to unilaterally impose tariffs. Second, there is a possibility that some of the “reciprocal” tariffs could be reduced ahead of the April 9 implementation date, which would soften, though not reverse, the April 2 announcement. Third, legal challenges may emerge against several of the new measures, many of which rest on shaky legal ground. Lastly, March labor data from both BLS and ADP still point to a resilient employment backdrop, though risks clearly lie ahead as tariff effects begin to filter through.
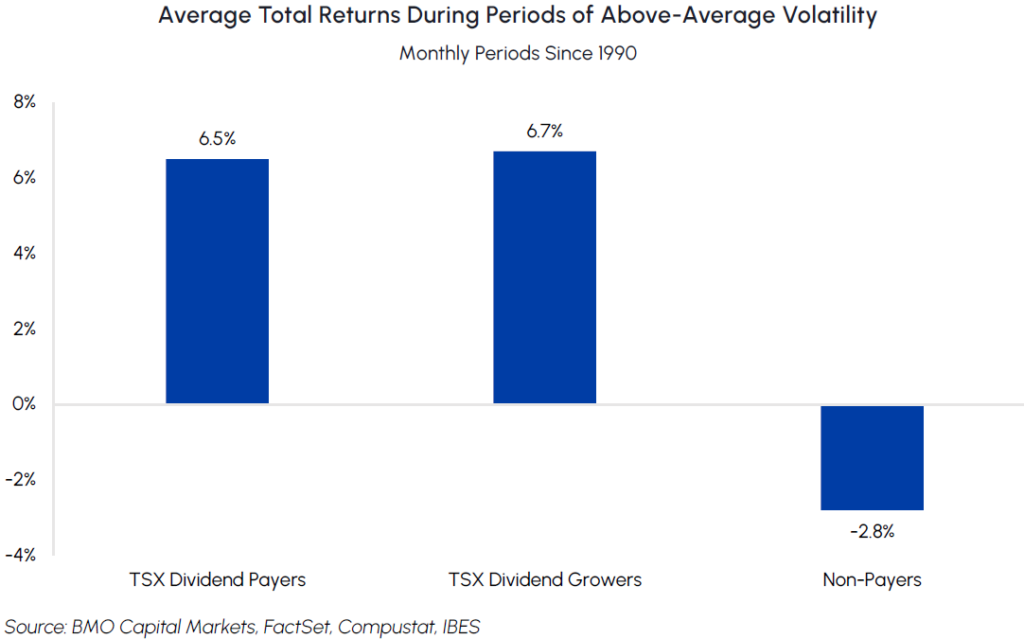
Dividend-focused strategies remain a highly effective and defensive approach to navigating periods of elevated market volatility and uncertainty. Since 1990, dividend payers typically outperform when the VIX is above its three-year average and when overall market volatility is rising. Our funds emphasize dividend payers with strong balance sheets and competitive moats. We believe investors should be adding exposure to dividend growers to mitigate volatility without compromising exposure to market upside.
Real Estate
Middlefield Fund Tickers & Codes: MREL / MID 600 / RS / RS.PR.A
by Dean Orrico, President & CEO
Canadian REITs performed in-line with the TSX in March, generating a total return of -1.4%. REITs have provided downside protection amidst market volatility with the TSX Capped REIT Index down 4.7% during the post Liberation Day two session correction compared to the TSX returning -8.4%. Considering their inflation hedging qualities, declining interest rates and the contractual nature of REIT cash flows, we believe the real estate sector is well-positioned to outperform during the current market volatility.
Last month we highlighted that multi-family apartment REITs were trading at trough valuations despite solid fundamentals and improving sentiment. Residential REITs returned 7.9% in March and were the top-performing sub-industry in the sector. The move was catalyzed by an announcement on March 10th when an activist investor announced a 9% stake in InterRent REIT. The activist is pushing for strategic changes to unlock shareholder value, many of which are already underway at the company. These include non-core asset sales and an increase in share buybacks, both of which the company plans to accelerate this year. InterRent’s stock price rose 15.2% in March but remains excessively discounted and offers further upside.
Hudson Bay Company (HBC) filed for bankruptcy on March 7th involving a plan to liquidate 90 of its 96 locations. RioCan REIT, which has exposure to HBC primarily through a joint venture with HBC, has sold off more than 10% since the announcement. While the news creates uncertainty in the near-term, due to the overall tight supply dynamics in Canadian retail real estate, we expect the properties to ultimately be re-leased, redeveloped, or disposed over the long-term with favourable economics. RioCan recently noted that retailers are already expressing interest in several HBC locations which would be leased at higher rents than current levels. Further, RioCan has the balance sheet strength and experience to navigate the HBC bankruptcy, evidenced by its ability to address large tenant failures in the past (e.g., Target). The recent pullback in RioCan creates an excellent opportunity in a bellwether retail REIT anchored by high-quality, necessity-based tenants.
Healthcare
Middlefield Fund Tickers & Codes: MHCD / MID 625 / SIH.UN
by Robert Moffat, Portfolio Manager
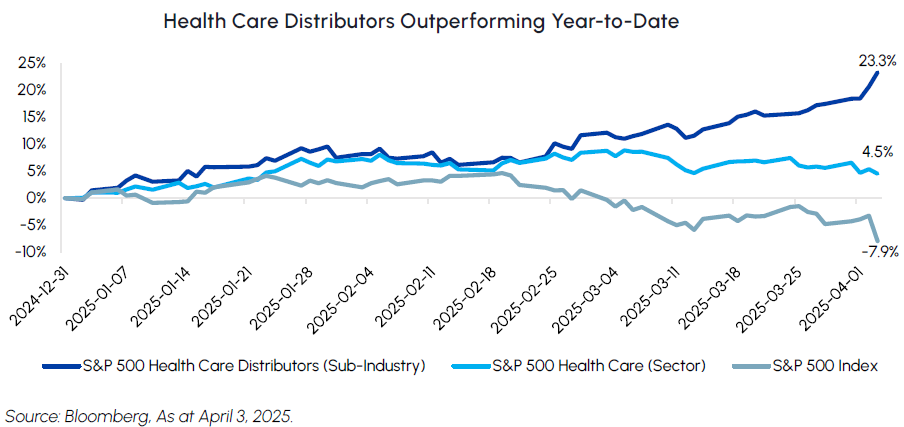
Healthcare continued its streak of outperformance in March, declining just 1.7% compared to the S&P 500 return of -5.6%. The sector was up 6.5% through the end of the first quarter, outperforming the broader market by more than 10%.
Healthcare’s defensive characteristics are what have been driving its strong relative performance. Healthcare spending is predominately non-discretionary and has inelastic demand. During the Great Financial Crisis, volumes of pharmaceutical products declined by approximately 2% but growth remained positive. Moreover, companies were able to maintain operating margins and free cash flow, leading to strong relative performance during this period. Amidst an uncertain market backdrop, healthcare stocks should continue to provide stability and insulation from macro headwinds.
Drug distributors remain one of the most defensive corners of the healthcare sector. The big three distributors (McKesson, Cardinal Health and Cencora) operate in an oligopoly, collectively handling over 90% of the nation’s wholesale drug distribution. As a result, these companies benefit from consistent drug utilization and resilient pricing dynamics, which support steady revenue growth and durable margins. Importantly, drug distribution also offers a natural hedge against inflation as distributors purchase inventory in bulk at current prices and sell into the future, benefiting from rising price levels without taking on significant cost risk. These qualities insulate distributors from reimbursement pressures, tariff risk, and broader healthcare policy uncertainty, serving as a reliable ballast within the healthcare complex. Our healthcare funds have been overweight drug distributors this year which has been a positive contributor to performance.
Infrastructure
Middlefield Fund Tickers & Codes: MINF / MID 265 / MID 510 / ENS / IS / IS.PR.A
by Robert Lauzon, Managing Director & CIO
European utilities and infrastructure stocks have emerged as top performers over the past quarter, benefiting from a combination of macroeconomic shifts, policy support, and renewed investor interest. After years of underperformance, these companies entered 2025 at deeply discounted valuations. Regime changes in key markets—such as Germany, the UK, and France—have driven more favorable policies that encourage investment in critical infrastructure and clean energy. Additionally, substantial fiscal stimulus across the EU has reinforced long-term cash flow stability for regulated utilities and infrastructure operators. With the Trump administration’s tariffs sparking a degree of economic nationalism, investors have begun diversifying away from U.S. equities, increasing allocations to high-quality European defensive assets. The business models of these companies—supported by stable, inflation-protected revenue streams and long-term investment cycles—make them highly attractive in the current environment. Given these tailwinds, our infrastructure funds, which have held key European names for several quarters, have benefited from both the sector’s re-rating and the diversification advantages of a globally balanced portfolio.
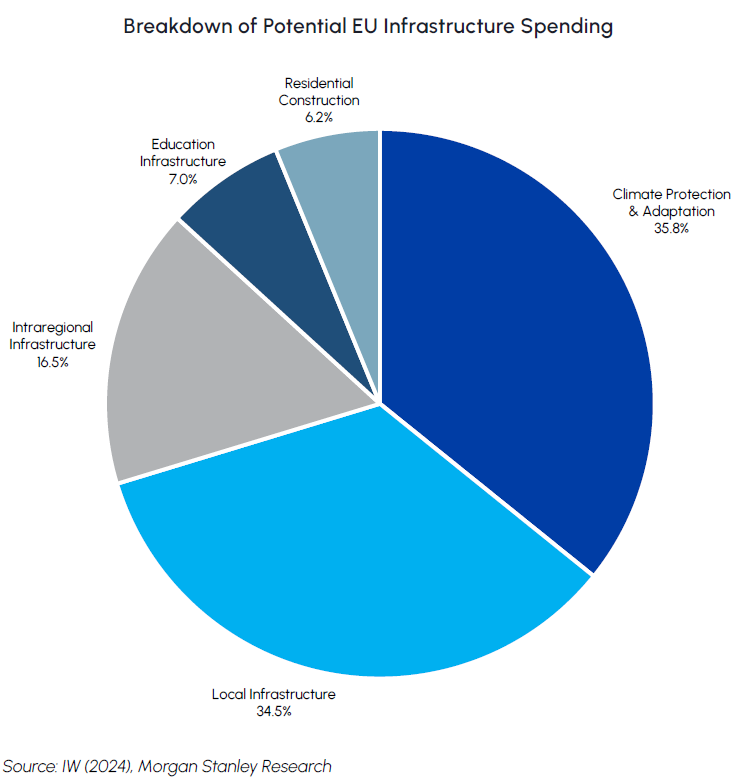
Eiffage, one of Europe’s leading construction and concessions operators, has been a standout performer year-to-date within the infrastructure and utilities space. With a record-high order book, strong revenue visibility, and improving margins, the company is capitalizing on favorable industry dynamics. Eiffage’s 2025 guidance points to further revenue and EBIT growth across all divisions, reflecting its strong execution and momentum. Despite this, the stock remains attractively valued at just 4.8x forward EV/EBITDA, well below its historical average of 7.5x. Management has been proactive with share buybacks, and its ownership stake in Getlink, along with the expansion of recurring maintenance contracts for France’s nuclear fleet, further enhances earnings stability. The company is also poised to benefit from Germany’s €500 billion infrastructure stimulus package, which will drive large-scale transport, energy, and construction projects over the next decade. With additional flexibility in regional government borrowing and a broader shift toward pro-infrastructure policies across Europe, Eiffage is in an ideal position to capitalize on this structural investment wave.
Technology & Communications
Middlefield Fund Tickers & Codes: MINN / SIH.UN / MID 925 / MDIV
by Shane Obata, Portfolio Manager
As we assess the technology sector in early April, the environment remains multifaceted. Investors continue to grapple with persistent macroeconomic questions and background noise, including lingering uncertainties around global trade dynamics and potential tariff impacts. Despite these complexities, the foundational drivers powering innovation and growth within technology appear robust, warranting a stance of cautious optimism. We believe that select areas within the sector, particularly those central to the artificial intelligence revolution, possess the enduring potential to generate above-market earnings growth, even against a challenging macro backdrop.
A crucial element in framing the current opportunity is recognizing where we stand within the broader AI investment cycle. By most estimates, we are roughly two and a half years into the most intense phase of investment and development, particularly sparked by the generative AI advancements that entered the mainstream consciousness in late 2022. While this period has seen significant capital deployment and rapid progress, it’s vital to place this timeframe in historical context. Major technological transformations, such as the multi-decade build-out of core telecom or the smartphone revolution that reshaped computing, unfolded over much longer durations. Compared to these historical precedents, the current AI wave focused on foundational models, cloud capacity, and specialized hardware is still relatively nascent, suggesting a substantial long-term runway for continued innovation, market development, and value capture remains ahead.
Evidence supporting this long-term view can be seen in current adoption trends, which are steadily moving beyond initial experimentation towards tangible integration. While consumer-facing tools have rapidly gained familiarity, the more significant indicator for sustained growth lies in enterprise adoption. We are seeing increasing reports and metrics indicating that corporations across various industries are transitioning from pilot projects to actively deploying AI tools and APIs within core business processes. This shift aims to unlock concrete benefits like enhanced productivity, improved customer engagement, and the creation of novel products and services, thereby fueling real demand for the underlying AI platforms, software, and infrastructure.
Looking ahead, the next major catalyst likely lies in the deep and seamless integration of advanced AI capabilities into the mobile phone – the primary computing interface for billions worldwide. While early iterations of on-device AI and enhanced features are emerging, the vision of a truly intuitive, context-aware AI assistant becoming a ubiquitous part of the mobile experience appears to be, conservatively, still a year or more from widespread reality. This pending integration represents a significant future driver for consumer AI adoption and opens vast new opportunities across the tech ecosystem, further reinforcing the notion that we are far from reaching peak AI penetration.
This confluence of a still-early investment cycle, growing real-world adoption, and significant future catalysts like mobile integration underpins the technology sector’s fundamental strength. Its historical capacity for innovation and alignment with powerful secular trends such as digitalization and cloud computing are now amplified by AI’s potential to drive efficiency and create value. This provides a basis for leading technology companies to continue delivering compelling earnings growth, offering resilience even when faced with broader economic or trade-related uncertainties. Therefore, while acknowledging the path forward will inevitably involve challenges, the long-term tailwind provided by the AI transformation presents a compelling opportunity for MINN investors who are well positioned to benefit from our continued focus on high quality technology leaders.

Resources
Middlefield Fund Tickers & Codes: MID 800 / MID 161 / MID 265 / MRF FT LP / Discovery FT LP
by Dennis da Silva, Senior Portfolio Manager
Gold’s weekly gains continued through March with the price of the metal hitting a record high early in April. The precious metal has been up on a weekly basis in twelve out of the last thirteen weeks, extending the 5-year bull market for the commodity. Uncertainty caused by tariffs has been the most recent contributor to gains that are fundamentally supported by a multitude of macroeconomic and geopolitical factors such as ongoing central-bank demand for gold. Geopolitical shifts are causing countries to diversify their foreign reserves, with gold a primary beneficiary. Bloomberg recently reported that official gold reserves have risen US$725 billion over the last four years, 60% more than the decline in official dollar denominated reserve assets. A looming trade war is likely to accelerate the trend of central bank purchasing and wider de-dollarization. The strong performance of gold equities relative to gold continued into March with bullion up 9.3% versus the 14.8% gain of the S&P/TSX gold equities index.
We believe the current tariff uncertainty with the U.S. could benefit Canadian energy in the long run. Canada has become overly reliant on the U.S. for energy exports and provincial governments have established trade and mobility barriers in recent years. This has resulted in a series of major project cancellations and policy decisions that have handcuffed Canada’s options for selling our natural resources. In an open letter published mid-March, the CEOs of 10 of the largest oil and natural gas companies and the four largest pipeline companies called for the leaders of four federal political parties to declare a Canadian energy crisis and use emergency powers to help speed the development of key projects in the national interest. The changing sentiment toward large scale energy infrastructure projects may prove momentous and constructive for the strength and resilience of the Canadian economy for future generations.
Exchange Traded Funds (ETFs)
Mutual Funds (FE | F)
TSX-Listed Closed-End Funds
| Fund | Ticker | Strategy |
|---|---|---|
| MINT Income Fund | MID.UN | Equity Income |
| Sustainable Innovation & Health Dividend Fund | SIH.UN | Innovation & Healthcare |
TSX-Listed Split Share Corps. (Class A | Preferred)
| Fund | Ticker | Strategy |
|---|---|---|
| E-Split Corp. | ENS | ENS.PR.A | Energy Infrastructure |
| Real Estate Split Corp. | RS | RS.PR.A | Real Estate |
| Infrastructure Dividend Split Corp. | IS | IS.PR.A | Infrastructure |
LSE-Listed Investment Fund
| Fund | Ticker | Strategy |
|---|---|---|
| Middlefield Canadian Income Trust | MCT | Canadian Equity Income |
Commissions, trailing commissions, management fees and expenses all may be associated with mutual fund investments, including ETFs. Please read the prospectus before investing. You will usually pay brokerage fees to your dealer if you purchase or sell units/shares of investment funds on the Toronto Stock Exchange or other alternative Canadian trading system (an “Exchange”). If the units/shares are purchased or sold on an Exchange, investors may pay more than the current net asset value when buying and may receive less than the current net asset value when selling them. There are ongoing fees and expenses associated with owning units or shares of an investment fund. An investment fund must prepare disclosure documents that contain key information about the fund. You can find more detailed information about the fund in these documents. Mutual funds and investment funds are not guaranteed, their values change frequently and past performance may not be repeated. Certain statements in this disclosure are forward-looking. Forward-looking statements (“FLS”) are statements that are predictive in nature, depend upon or refer to future events or conditions, or that include words such as “may”, “will”, “should”, “could”, “expect”, “anticipate”, “intend”, “plan”, “believe”, or “estimate”, or other similar expressions. Statements that look forward in time or include anything other than historical information are subject to risks and uncertainties, and actual results, actions or events could differ materially from those set forth in the FLS. FLS are not guarantees of future performance and are by their nature based on numerous assumptions. Although the FLS contained herein are based upon what Middlefield Funds and the portfolio manager believe to be reasonable assumptions, neither Middlefield Funds nor the portfolio manager can assure that actual results will be consistent with these FLS. The reader is cautioned to consider the FLS carefully and not to place undue reliance on FLS. Unless required by applicable law, it is not undertaken, and specifically disclaimed that there is any intention or obligation to update or revise FLS, whether as a result of new information, future events or otherwise.
This material has been prepared for informational purposes only without regard to any particular user’s investment objectives or financial situation. This communication constitutes neither a recommendation to enter into a particular transaction nor a representation that any product described herein is suitable or appropriate for you. Investment decisions should be made with guidance from a qualified professional. The opinions contained in this report are solely those of Middlefield Limited (“ML”) and are subject to change without notice. ML makes every effort to ensure that the information has been derived from sources believed to reliable, but we cannot represent that they are complete or accurate. However, ML assumes no responsibility for any losses or damages, whether direct or indirect which arise from the use of this information. ML is under no obligation to update the information contained herein. This document is not to be construed as a solicitation, recommendation or offer to buy or sell any security, financial product or instrument.